

Anatomy of PEAQ – the Audio Quality Metric
This article pulls the covers off the audio quality metric called PEAQ (Perceptual Evaluation of Audio Quality) and takes a look inside. It will allow users of the PEAQ measurement to understand how they can tune their devices under test and tweak simple empirical properties such as frequency response in order to achieve a better music or media experience.
Subjective Testing
Subjective testing involves human beings listening to a few seconds of audio music and making an assessment of the overall quality or the extent to which impairments can be recognized. Within the PEAQ community the difference between the reference file and the test file is called the Subjective Difference Grade (SDG).
Subjective testing attempts to achieve some level of repeatability between tests and different groups of listeners. With music quality testing, the listener is asked to listen to the reference file and then to two supposed test files. One of these test files is the original reference. I imagine this is some kind of lie detection, I guess. However, the other test file is the true degraded one that has been equipped with certain typical impairments for the subjective test..
Introduction to Perceptual Metrics
In essence, the fundamental objective of perceptual metrics is to program a computer to do the job of human beings. Human beings subjectively evaluate the quality of audio or voice clips but this is time consuming an expensive. The computer does this by starting with empirical audio measurements such as frequency response and taking the difference between the reference and degraded frequency response and map it or correlate it to a psychoacoustic model of the human ear and then how the brain receives sounds. For example, loudness is a measure of which frequencies transmitted at a given amplitude cause more of a sensation or maybe even more of annoyance to the human auditory system than other frequencies.
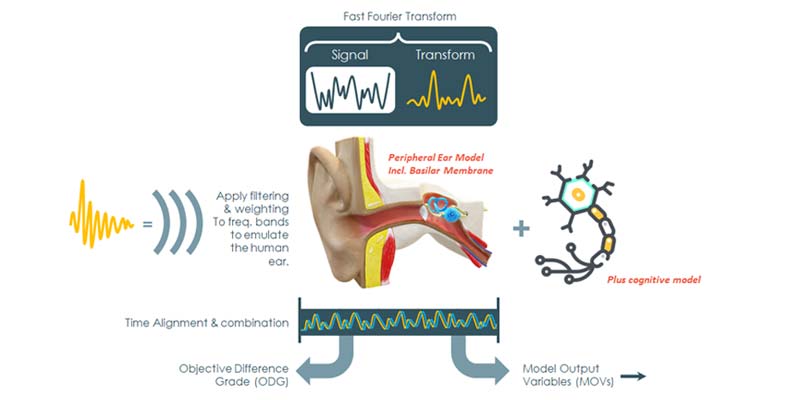
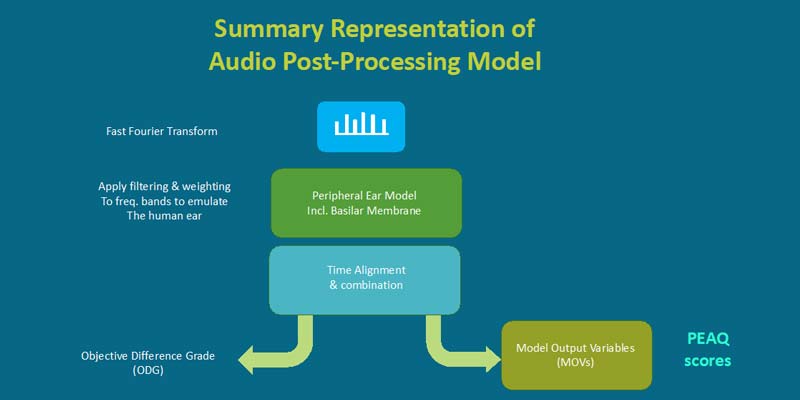
A computer model of the human ear has been developed over the years comprising the outer ear, the basilar membrane and the use of hairs in the cochlea to convert acoustics signals to electrical signals in the neurons of the brain.
A Quick Word on Perceptual Measurement
Perceptual quality metrics give an indication of how human beings rate their perception of the audio or speech, e.g., Mean Opinion Score (MOS). Similarly, to other perceptual quality metrics, processing of PEAQ starts with an FFT of the original input test signal incident or transmitted into the System Under Test (SUT/DUT). We call this signal the Reference. The output signal is the Degraded signal. These two signals are then compared using post processing software implementing the PEAQ algorithm. The difference between the FFTs of these signals is called the Objective Difference Grade (ODG).
Mapping ODG to PEAQ
| Description of Impairments | Objective Difference Grade (ODG) | PEAQ ITU-R Grade |
|---|---|---|
| Imperceptible | 0.0 | 5 |
| Perceptible but not annoying | -1.0 | 4 |
| Slightly annoying | -2.0 | 3 |
| Annoying | -3.0 | 2 |
| Very annoying | -4.0 | 1 |
The Objective Difference Grade (ODG) is the FFT of the difference between the FFT of the reference file versus the FFT of the degraded file. The algorithm then uses this to process it with the Model Output Variables (MOVs) to derive a PEAQ score.
In order to derive PEAQ from ODG, we multiply this difference with MOVs which are signal analysis parameters for which the human ear is specifically sensitive to. This allows us to tune the ODG signal to a metric that is more closely correlated with human subjective experience. This is called PEAQ.
MOVs are physical measurements of the difference between the reference vs. degraded signal which model the human ear and reflect perceptual features of the audio creating the PEAQ score from the ODG.
Model Output Variables
Notes: They are used as Scaling Factors for the Inputs of the Basic and Advanced Versions of PEAQ. The basic version uses all 11 MOVs whereas the advanced version uses only the first 5 MOVs to produce a PEAQ score.
| Sequence | MOVs | Description |
|---|---|---|
| 1 | AvgBwRef | Average Bandwidth of the Reference Signal |
| 2 | AvgBwTst | Average Bandwidth of the output signal of the device under test |
| 3 | NMRtotB | Total Noise-to-Mask Ratio |
| 4 | ADB | Average Distorted Block (Frame), taken as the logarithm of the ratio of the total distortion to the total number of severely distorted frames |
| 5 | MFPD | Maximum of the Probability of Detection after low pass filtering |
| 6 | EHS | Harmonic structure of error over time |
| 7 | RDF | Relative Proportion of frames for each frequency band that contain significant noise |
| 8 | WModDif1B | Windowed averaged difference in modulation (envelopes) between Reference Signal and Signal under Test |
| 9 | AModDif1B | Averaged modulation difference |
| 10 | AModDif2B | Averaged modulation difference with emphasis on introduced modulations and modulation changes where the reference contains little or no modulations |
| 11 | NLoudB | RMS value of the averaged noise loudness with emphasis on introduced components |
Sample Music Test Files
We also suggest a library of music files that provide good results for PEAQ and can be used repeatedly to provide consistent results ensuring that changes in the values, reflect only changes in the quality of the device under test (DUT).
Signal Concepts
For a good clear level set of these empirical concepts for analyzing signals, review our Signal Analysis Concepts.

